The Popularity of the Sport
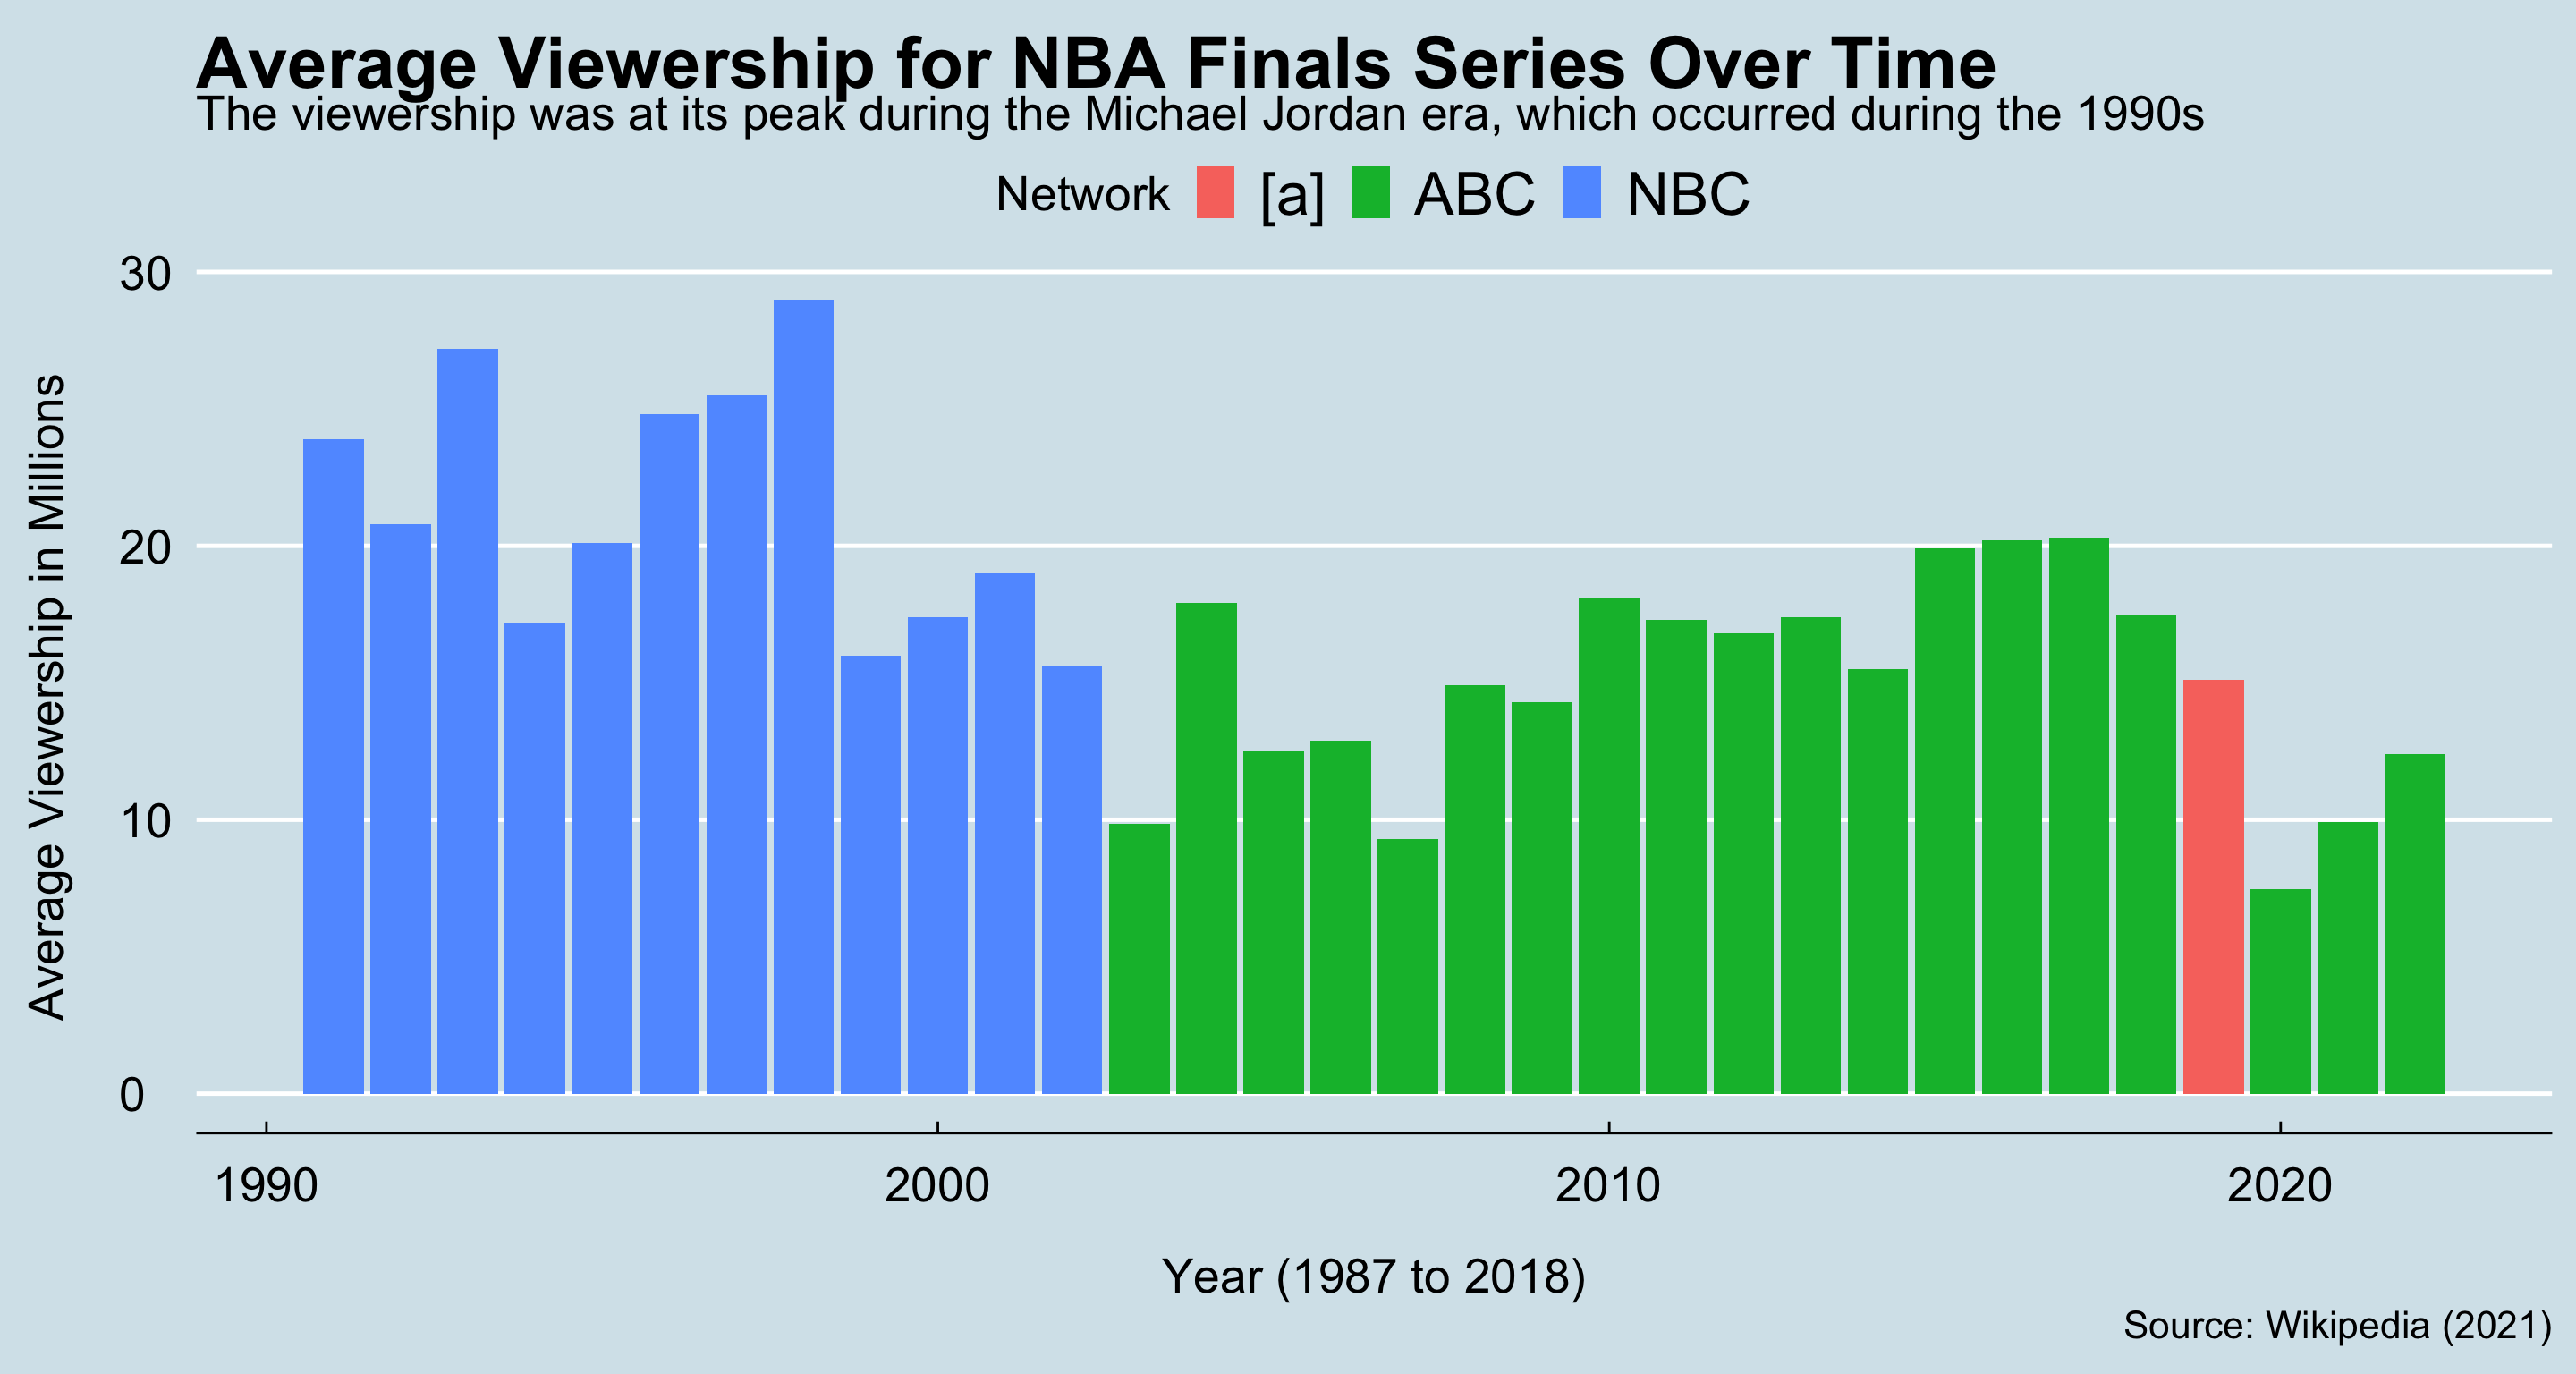
Let’s first start by taking a look at the overall popularity of the sport. An easy way for us to do this would be by analyzing some of the viewership statistics. Below, we have a graph that depicts the viewership in millions for the NBA Finals series. It is evident that the viewership reached its peak for the NBA Finals series during the Michael Jordan era of basketball. After that, the viewership declined heavily; however, it looks to be back on the rise again.
Moving on, we should also take a look at the reach basketball has on
the entire globe. This factor is important to consider since basketball
was only created in 1891, which is pretty late in comparison to other
sports (sports like soccer have been around in some fashion since as far
back as 2500 BC).
Nonetheless, the visualization below allows us to judge basketball’s reach by showing us where the players of the NBA have come from.

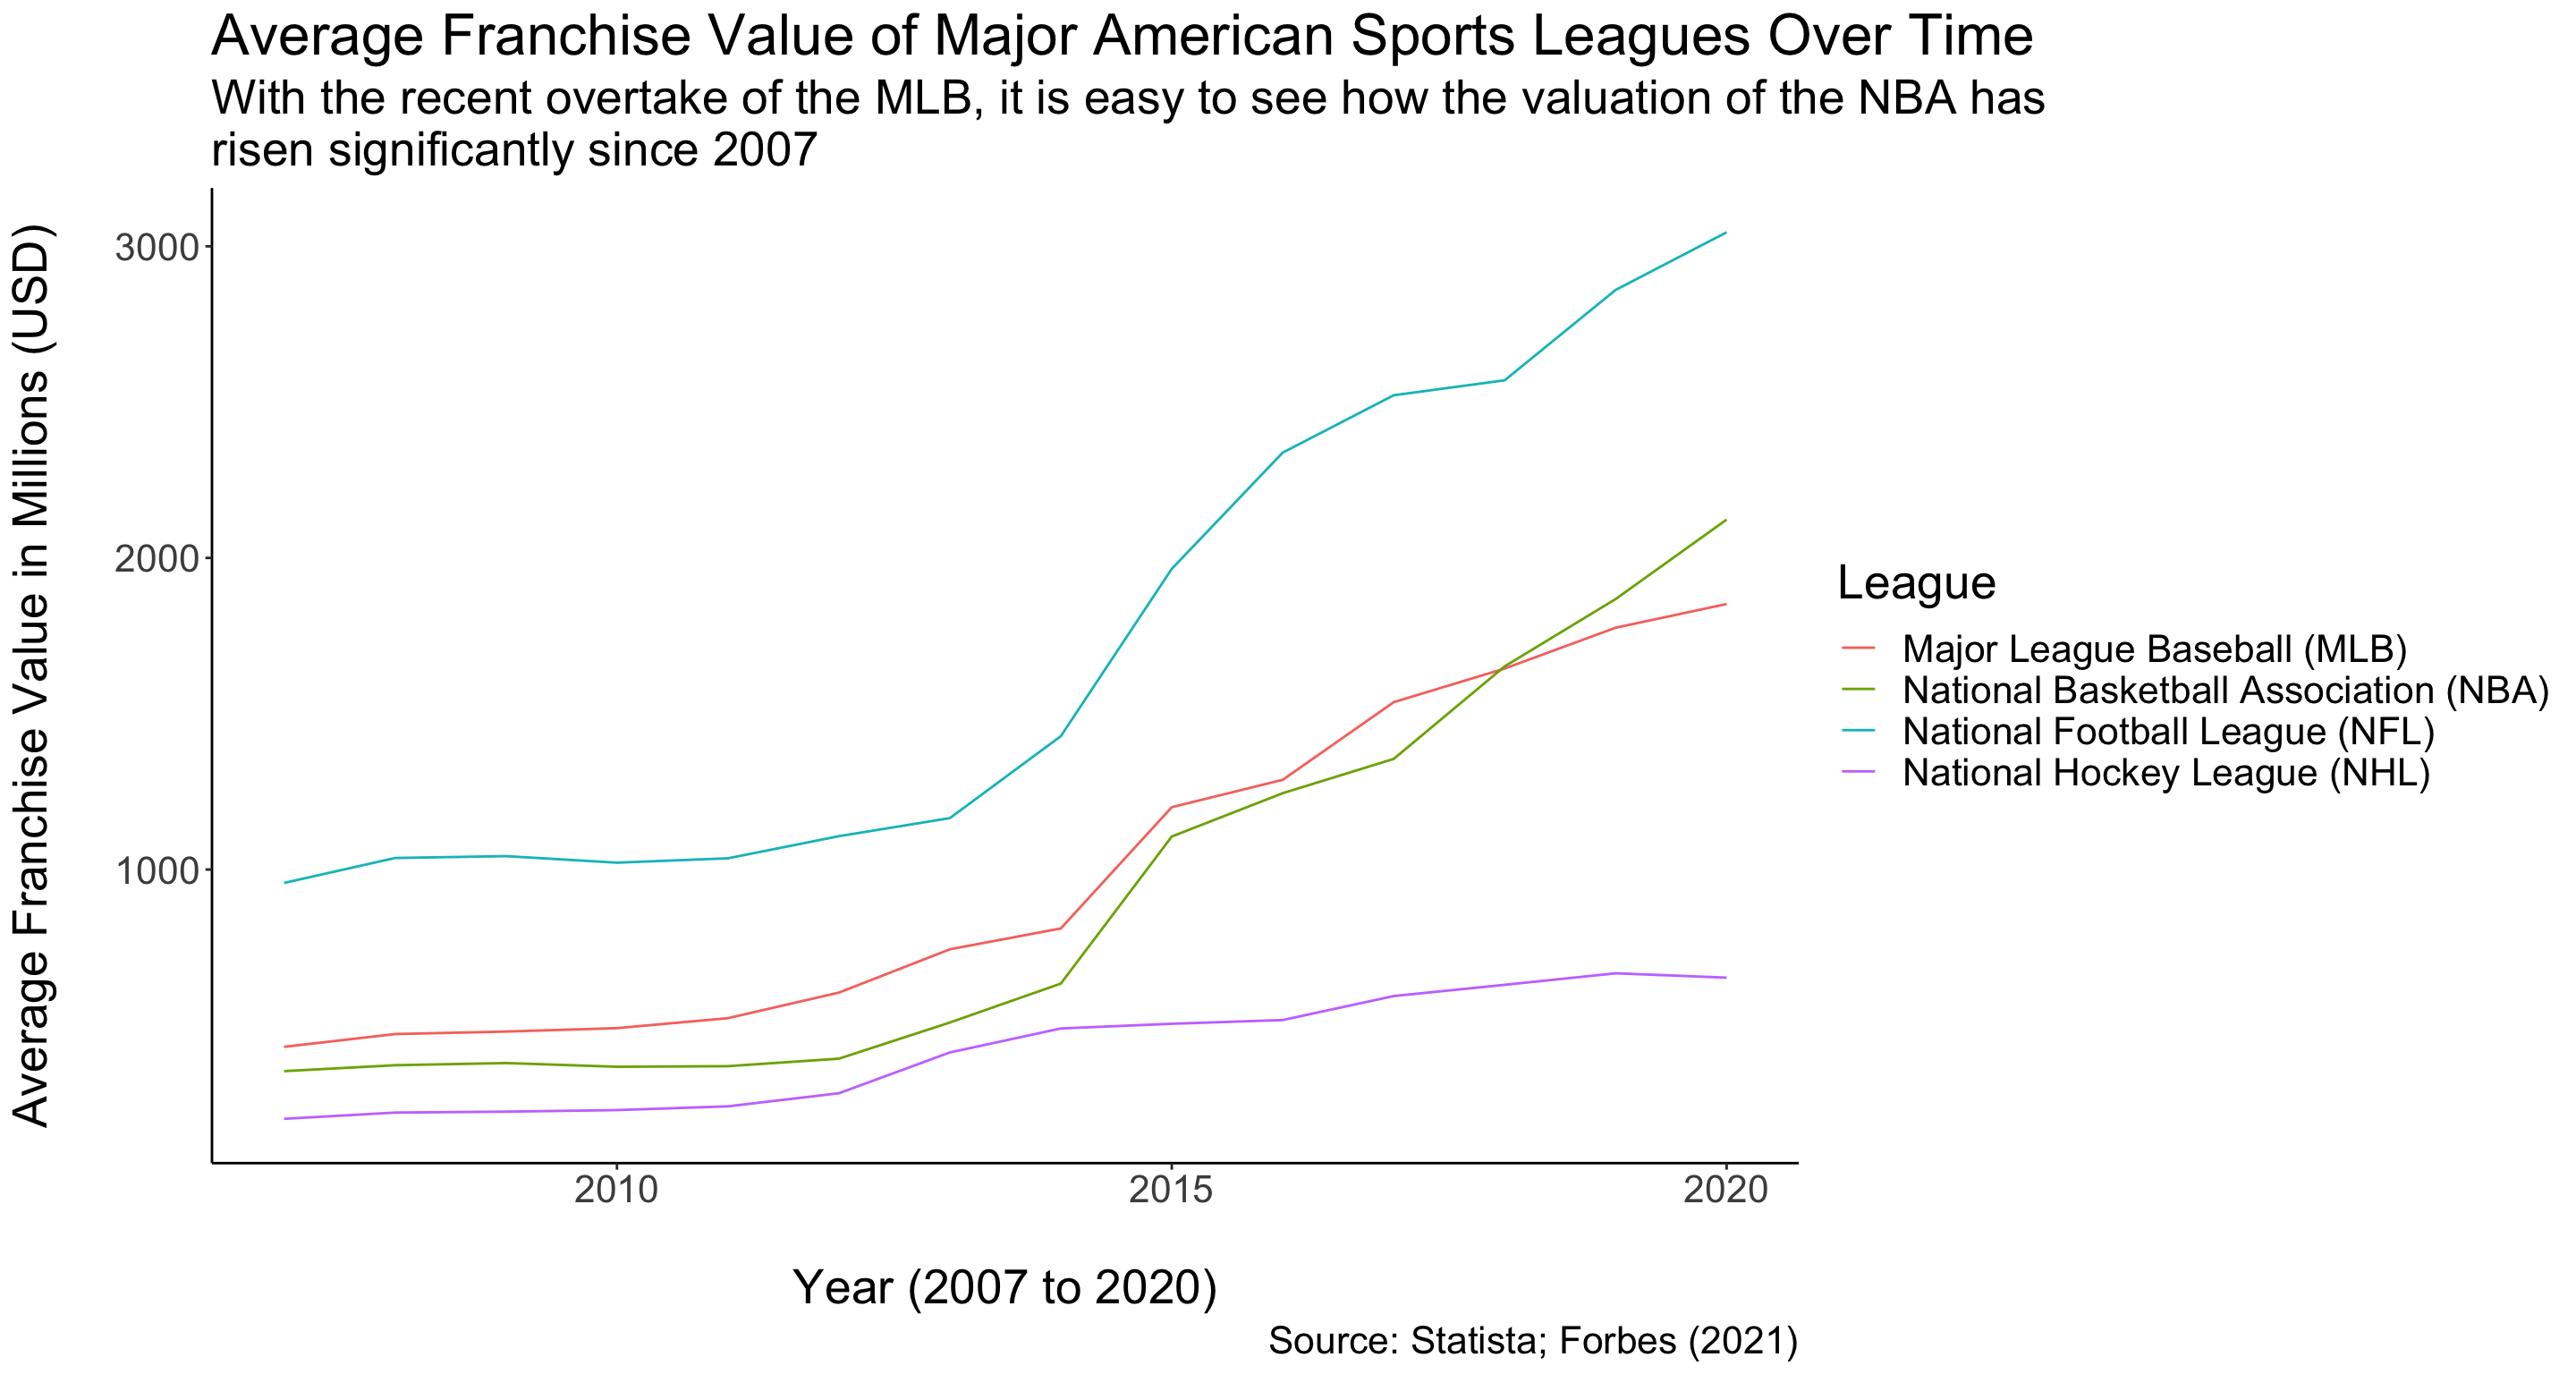
Another very important factor when considering the popularity of a sport is its financial value. Since sports are part of the entertainment industry, one of the most telling ways for us to determine its success is to analyze the amount of value they hold. As we can see, the graphic below shows us that although the NBA may not currently be the league with the highest average franchise value, they are one of the leagues with the highest increases, which is a good sign for the future. There are other non-American leagues to consider as well, but for the sake of this analysis, we will focus more towards the American sports leagues.
Statistics of the Game
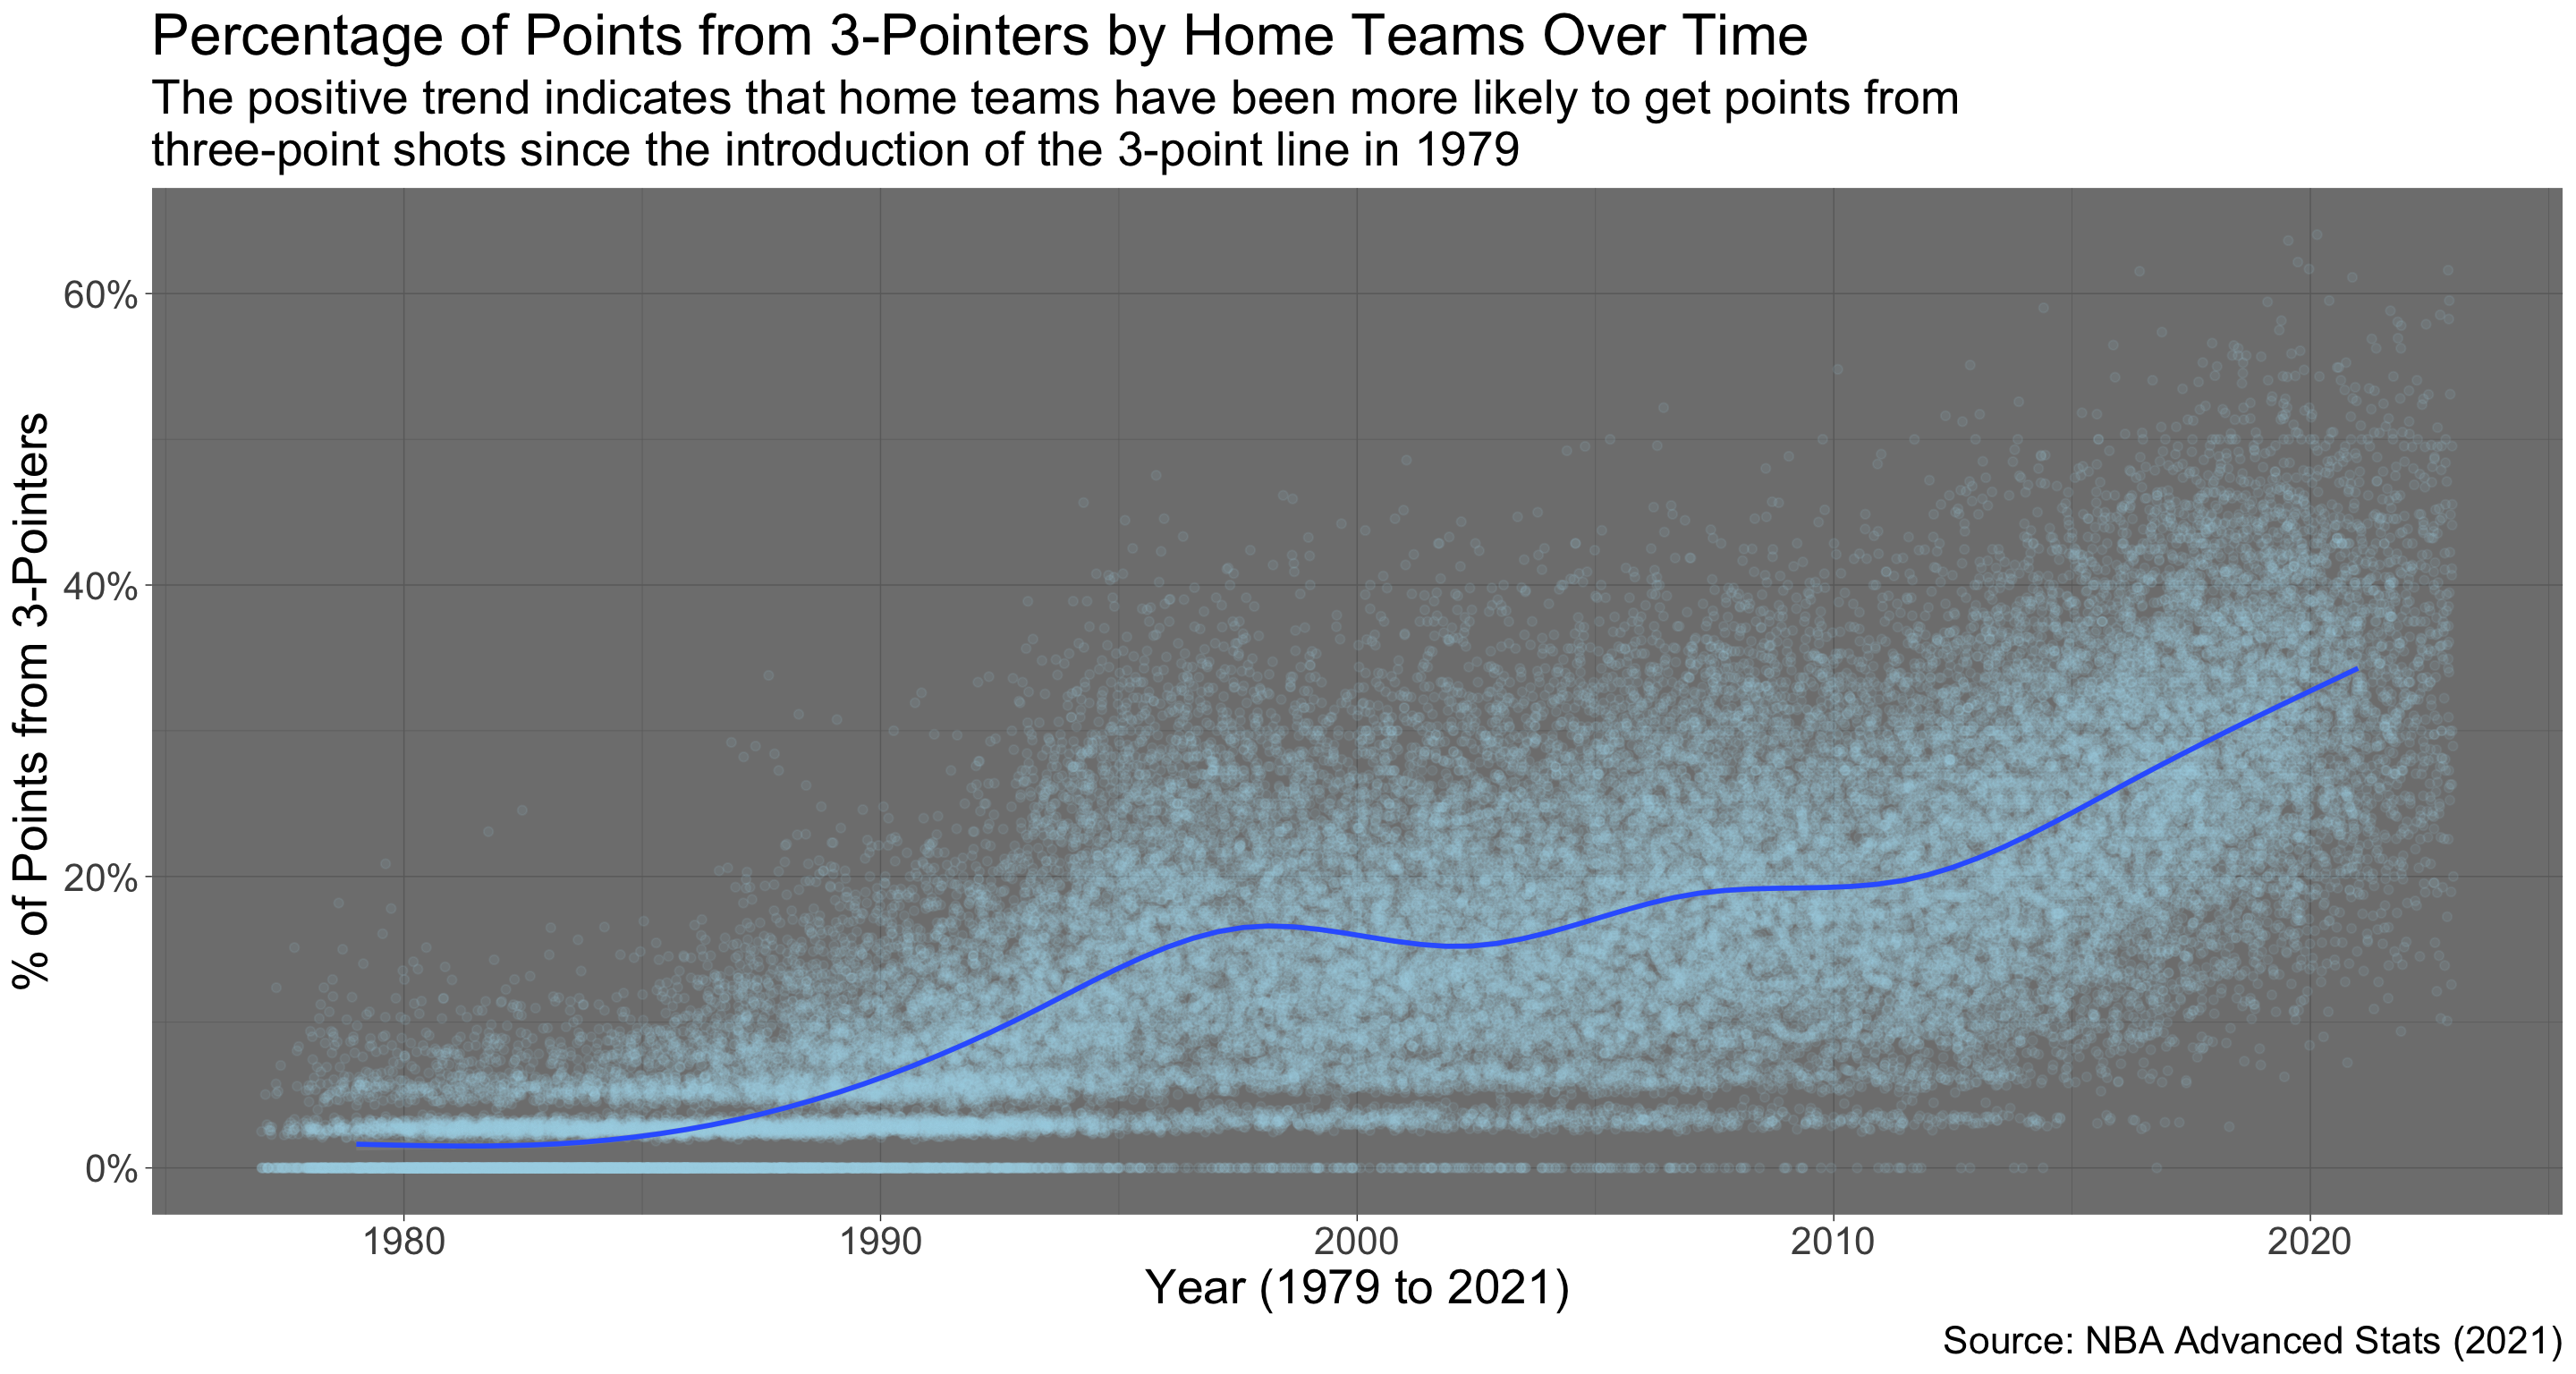
One of the main things that fans mention when asked about some of the biggest advancements in basketball is the evolution of the three-point line. Introduced in 1979, the three-point line has provided players an opportunity to make more points for a made shot than the standard two-point basket. Since then, the implementation of this three-point line into the game-plans of coaches has increased significantly, as shown by the graph above.
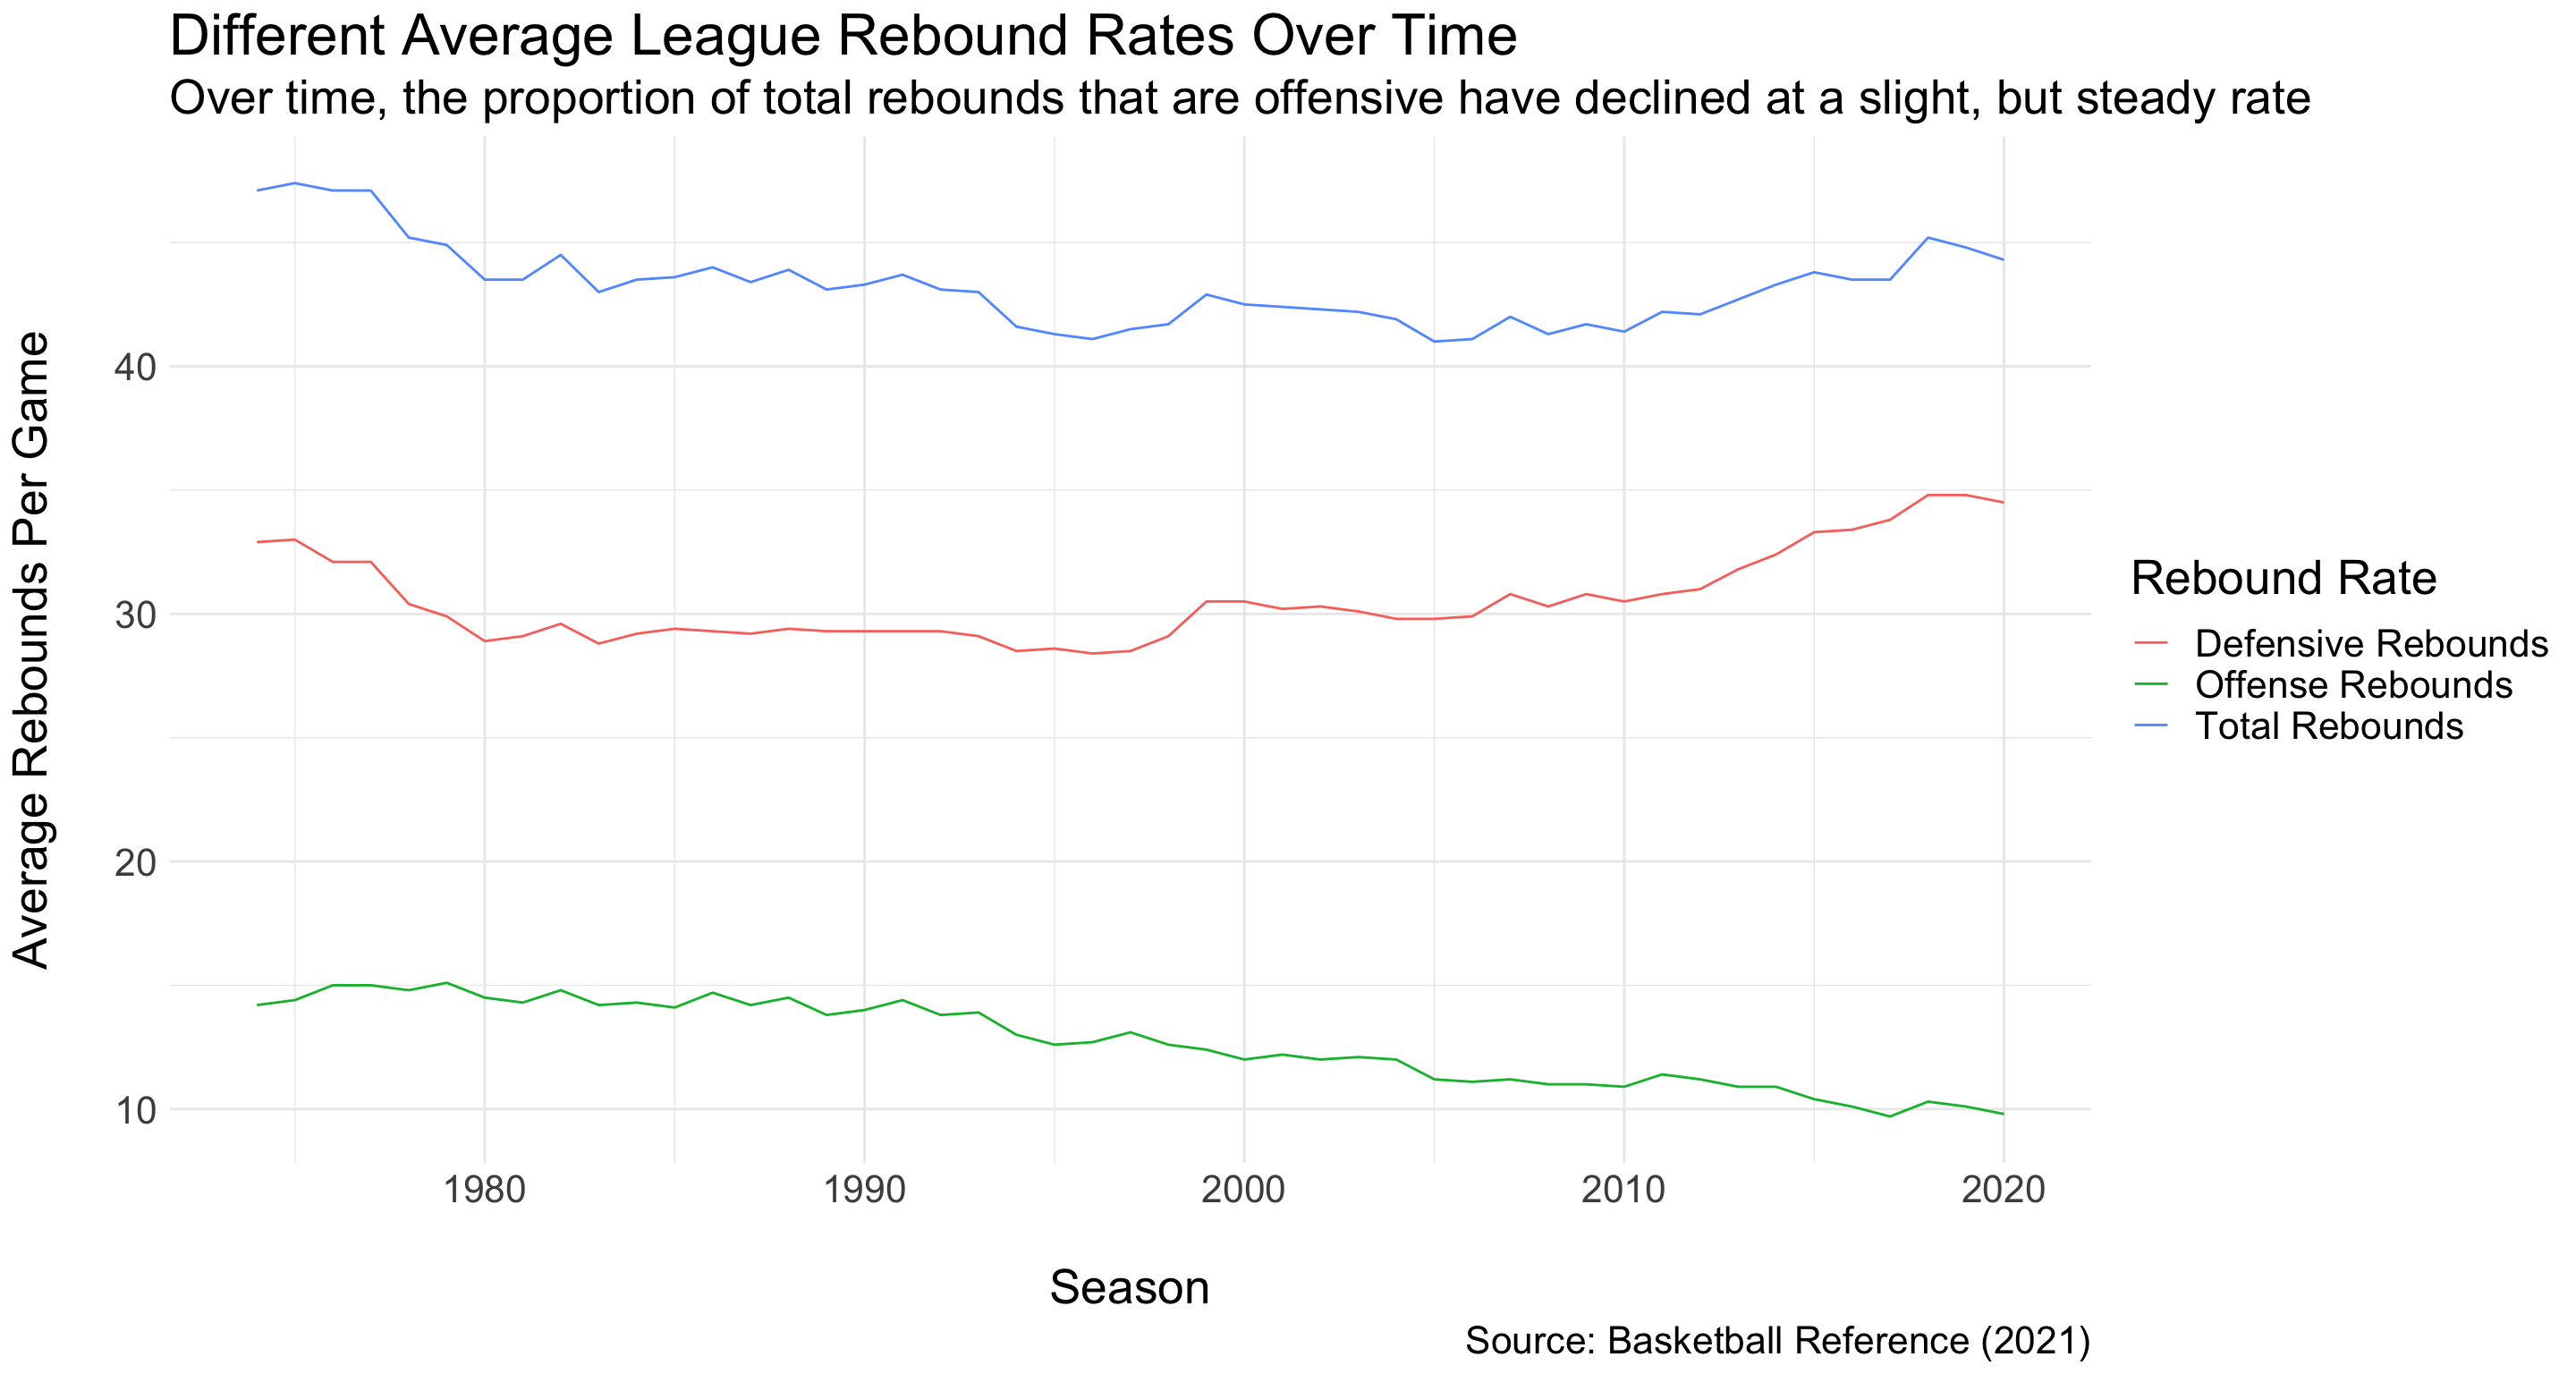
The graphic above signifies a slight decline in offensive rebound rates over time; however, from the previous plot, we also know there has been an increase in the percentage of points home teams have gained through three-pointers. Therefore, it is plausible that the decrease in offensive rebounds is due to increased floor stretching caused by the increase in three-point play schema usage.
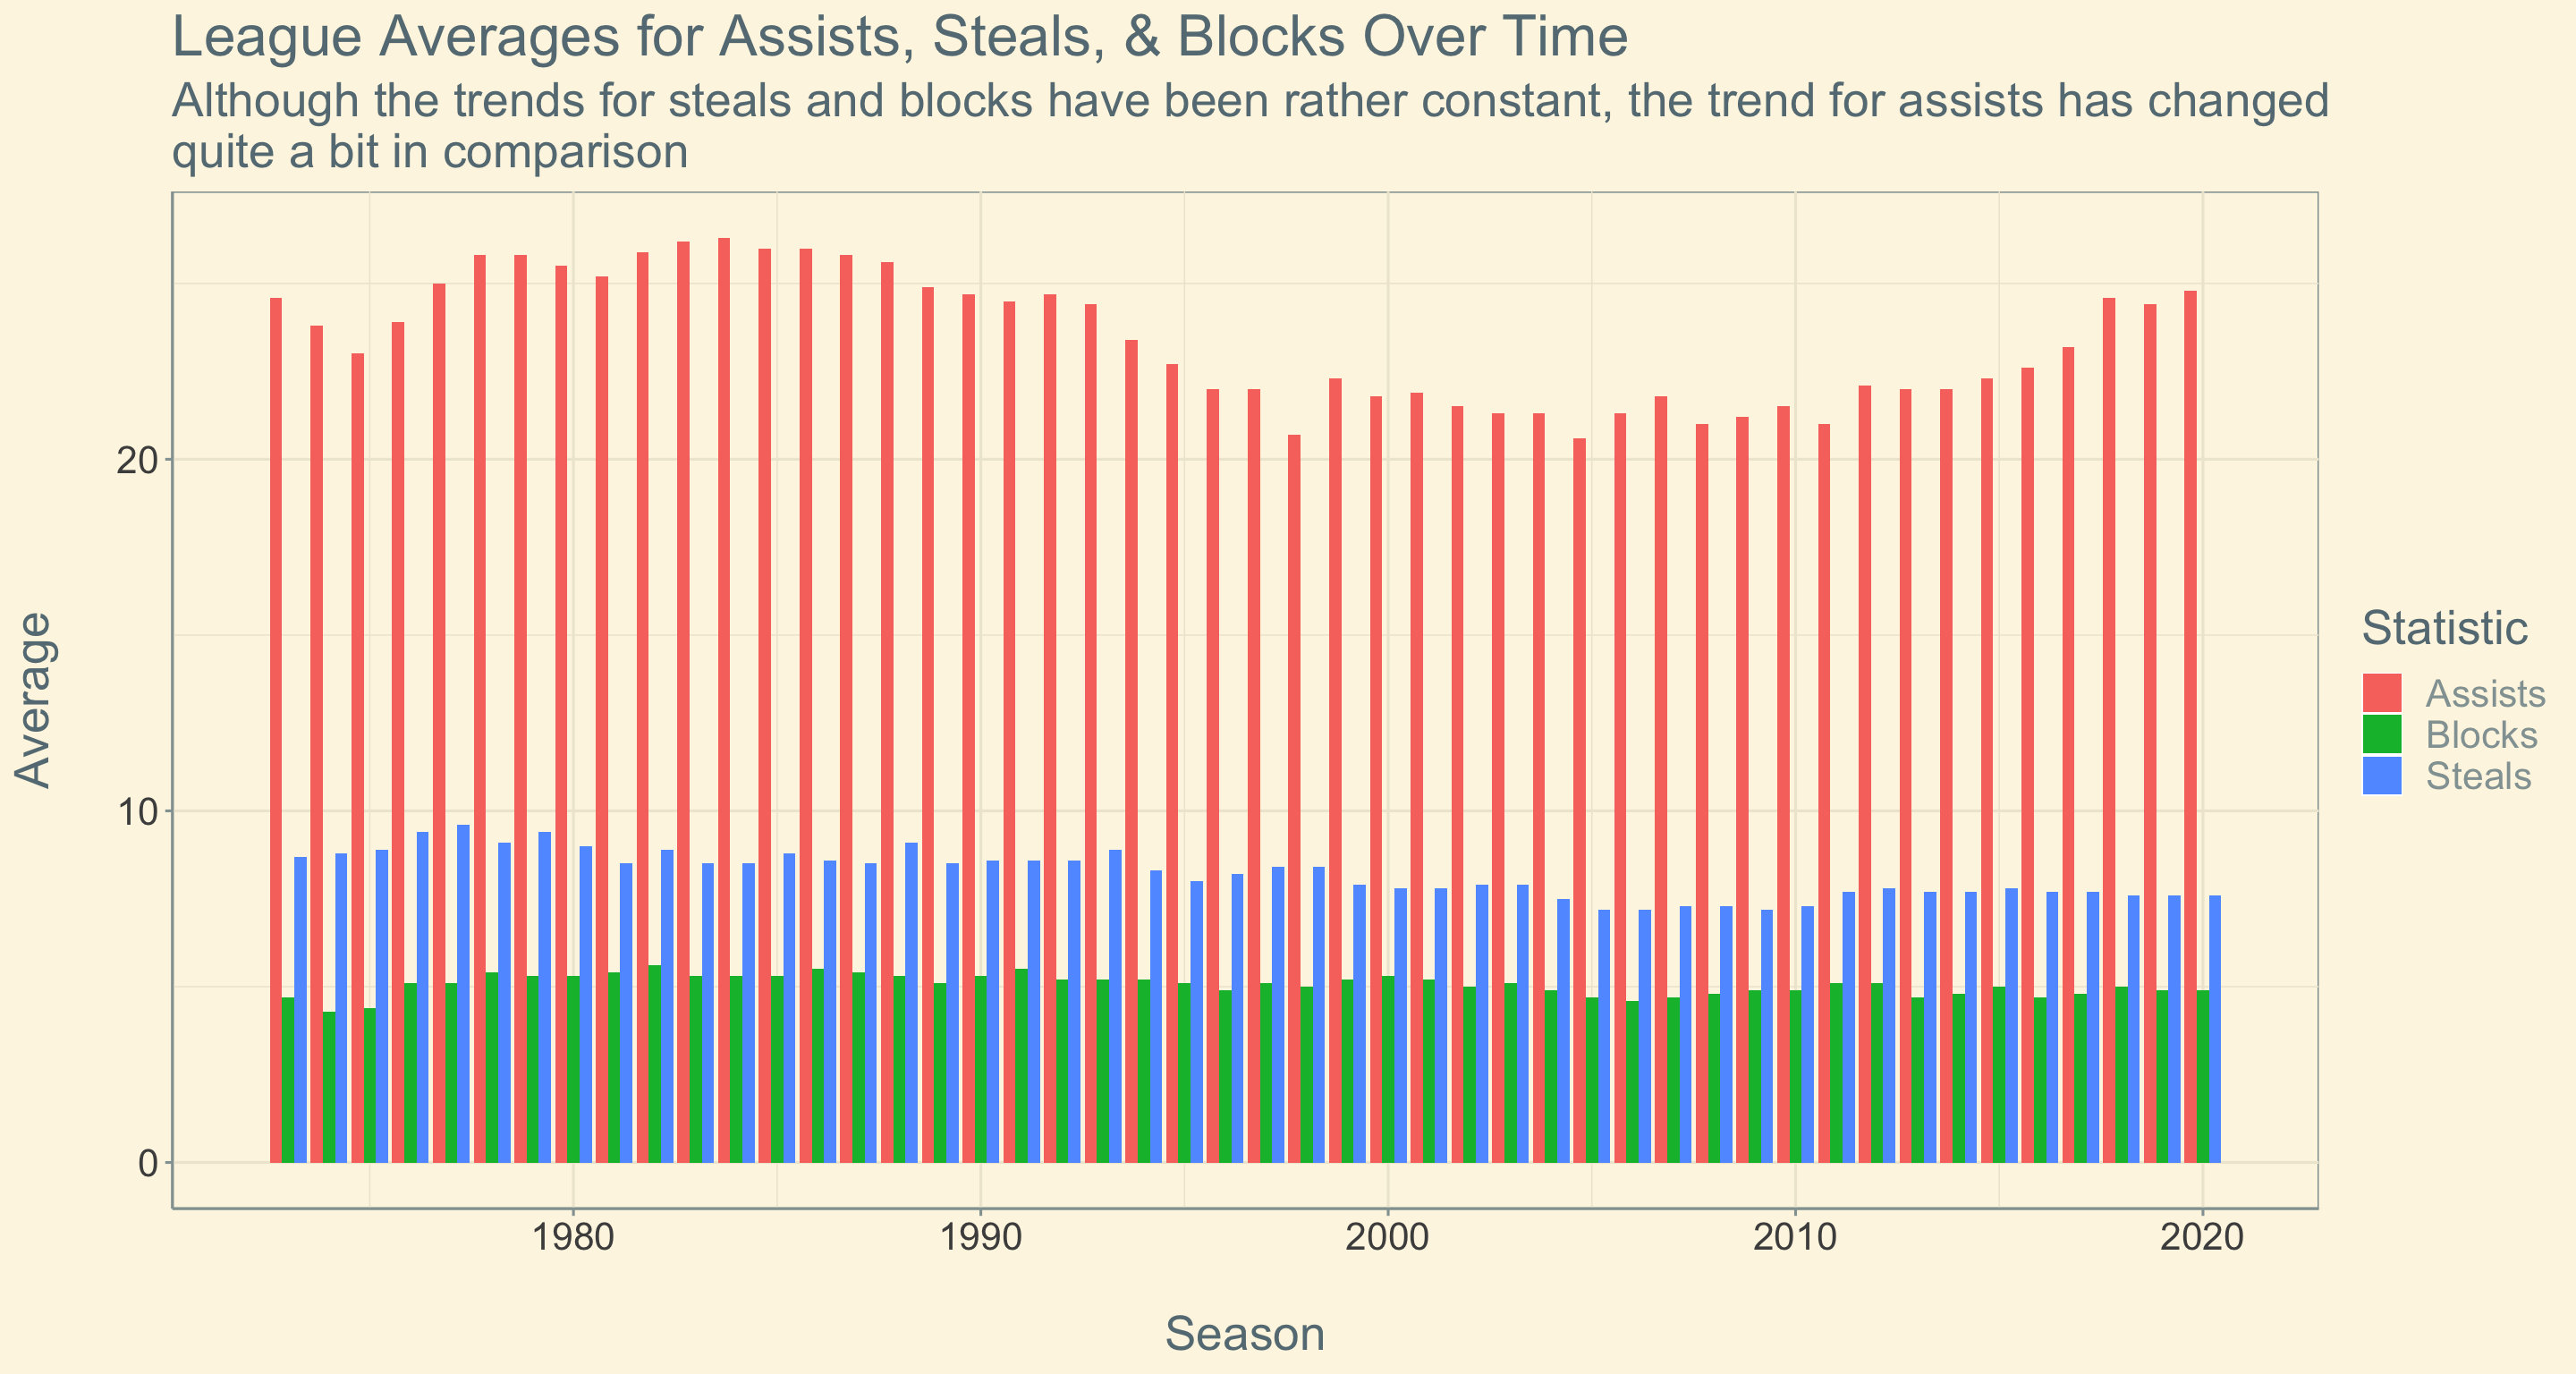
Other important statistics for basketball analytics as a whole
includes categories such as assists, steals, and blocks, as depicted in
the graph above. Although there have been a few minor trends in these
areas over time, there isn’t really anything too important to note.
Other Trends
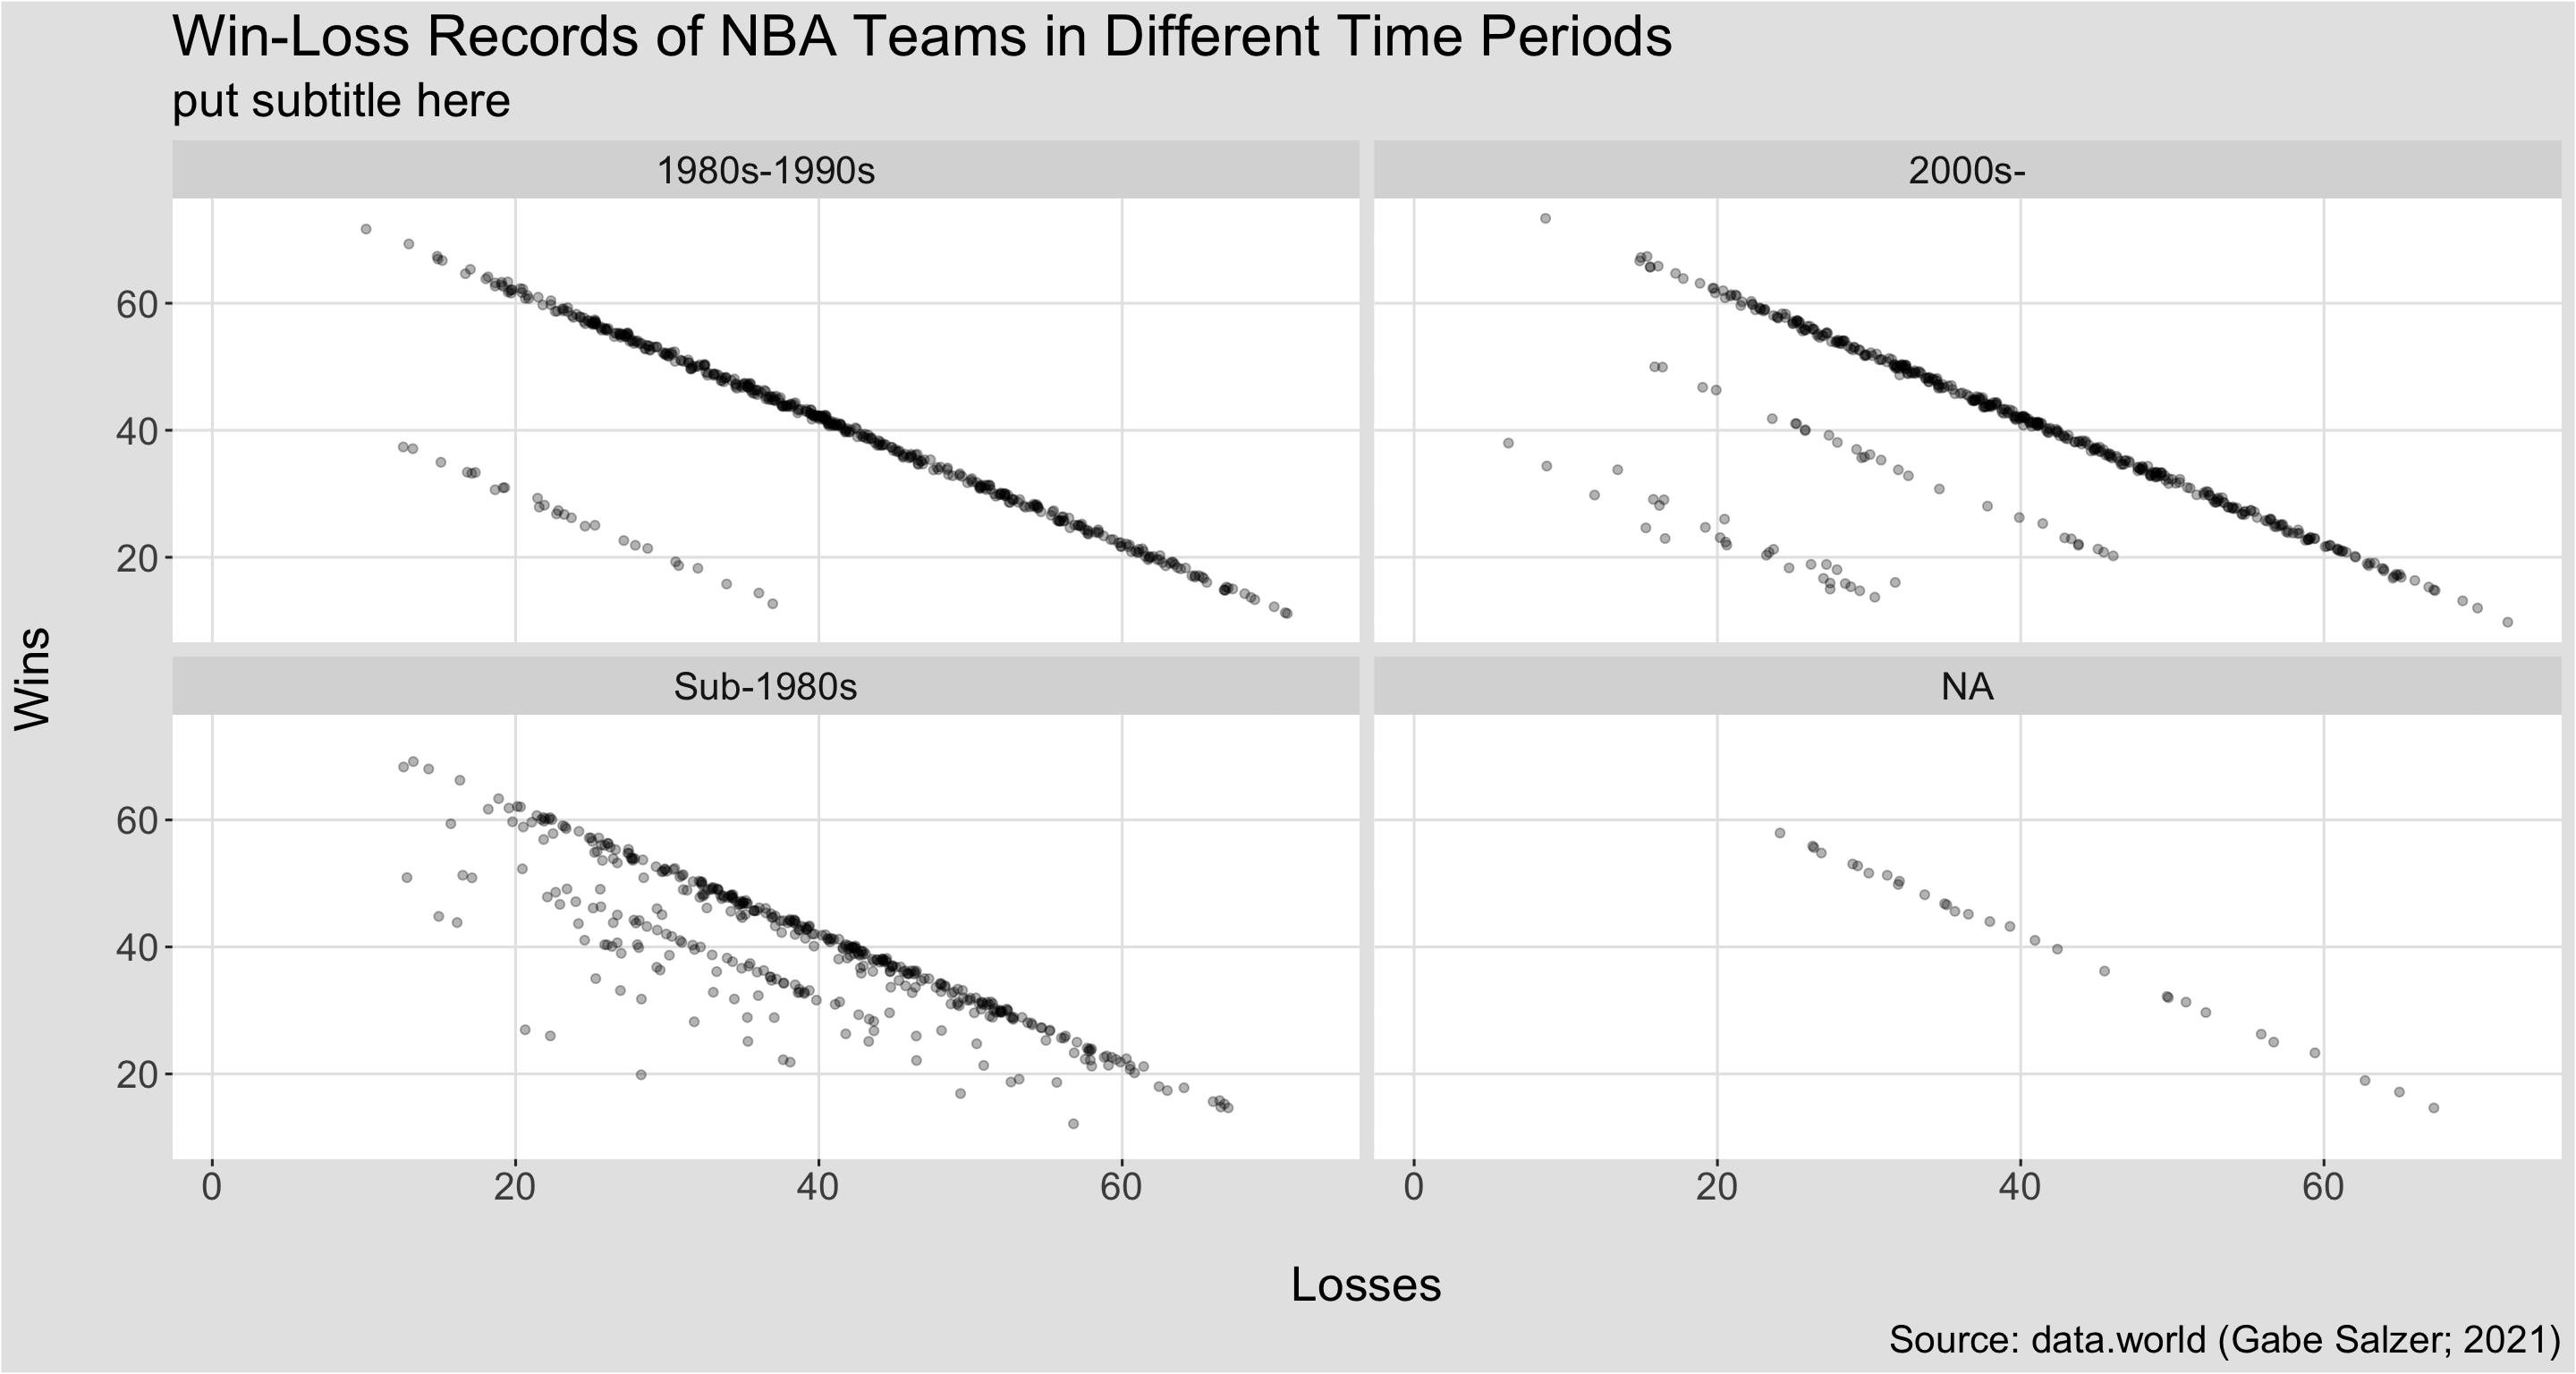
The graphic above displays the records of teams across the leagues from different time periods. Although the overall relationship between wins and losses is pretty similar across the time periods, we can see a clear difference in variation among some of the older win-loss records. However, it is to be noted that these observations are not very significant.